
The Global Quadruped Robots Market 2027-2037
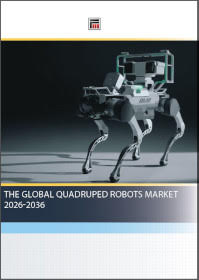
Quadruped robots, or four-legged robots, have become the most commercially mature group of general-purpose mobile robots. Once laboratory curiosities, they now work in industrial plants, energy facilities, construction sites and defence settings around the world. Their main advantage is dynamic legged locomotion. A quadruped can climb stairs, step over debris, cross gravel, mud and grating, squeeze through narrow corridors and recover from slips or collisions. Wheeled and tracked platforms struggle with all of these. Carrying cameras, thermal imagers, acoustic sensors, gas detectors and LiDAR, they can inspect, patrol and collect data in places that are dangerous, remote or tedious for people. Several developments have come together to move the market from trials to recurring commercial deployments:
Detailed forecasts for 2027–2037 cover revenue under conservative, base and optimistic scenarios, unit shipments, and splits by application, region, robot type and component. They also include total addressable market sizing and average selling price trends. Regional chapters analyse North America, Europe, China, Asia Pacific, the Middle East and Africa, and the rest of the world, covering policy, industrial demand and the security considerations that shape purchasing. The report includes 29 company profiles covering business overview, products and technology, funding and corporate developments, and strategic outlook.
- Proprioceptive actuators have become cheaper and stronger.
- Edge AI computers can now run perception and planning on board.
- Batteries last longer.
- Reinforcement learning has produced robust walking skills that transfer from simulation to the real world.
- Chinese manufacturers compete on scale, vertical integration and aggressive pricing, and have made legged robots widely accessible for research, education and price-sensitive industrial use.
- Western manufacturers focus on certified, high-reliability platforms for regulated and security-sensitive settings. These include explosion-proof designs for hazardous areas, cleanroom-qualified systems and ruggedised defence robots.
- Software companies build autonomy stacks, fleet-management platforms and integration services, so value is moving from the hardware to the intelligence and data layers.
The main applications are:
- oil and gas
- semiconductor fabs
- data centres
- power utilities
- mining
- construction
- perimeter security
- defence and public safety
- last-mile delivery
- agriculture
- disaster response
- actuator design and locomotion
- sensors and perception
- edge computing and AI
- batteries and power systems
- software architecture
- autonomy levels
- safety certification and cybersecurity
Detailed forecasts for 2027–2037 cover revenue under conservative, base and optimistic scenarios, unit shipments, and splits by application, region, robot type and component. They also include total addressable market sizing and average selling price trends. Regional chapters analyse North America, Europe, China, Asia Pacific, the Middle East and Africa, and the rest of the world, covering policy, industrial demand and the security considerations that shape purchasing. The report includes 29 company profiles covering business overview, products and technology, funding and corporate developments, and strategic outlook.
Report contents include:
- Executive summary with key findings and strategic implications
- Definitions, classification, historical development and business models, including robots-as-a-service
- Technology assessment: actuators, sensors, edge AI, batteries, software, autonomy, safety and cybersecurity
- Bill-of-materials analysis and component cost projections to 2037
- Analysis of twelve application and end-use markets
- Ecosystem and value chain mapping
- Competitive landscape: market share, positioning, pricing, specifications, M&A and funding
- Market forecasts 2027–2037 by scenario, units, application, region, robot type, component, TAM and ASP
- Regional analysis across six regions
- Profiles of 29 companies including AMC Robotics, Anduril Industries, ANYbotics, Boston Dynamics, Chironix, DEEP Robotics, Faraday Future, FieldAI, Formant, General Autonomy, Ghost Robotics, Intuitive Robots, Keybotic, Livox, Luwu Dynamics, MAB Robotics and more.....
- Glossary, research methodology and references
1. EXECUTIVE SUMMARY
1.1 Market Overview and Definition
1.2 Global Market Size and Forecast (2027–2037)
1.3 Quadrupeds vs Other Mobile Robot Form Factors
1.4 Levels of Autonomy for Quadruped Robots
1.5 Regional Ecosystem Dynamics
1.5.1 China: Hardware Dominance and Manufacturing Scale
1.5.2 North America: Vertical Integration and Defence Applications
1.5.3 Europe: Industrial Inspection and Safety Certification
1.5.4 Asia Pacific (ex-China), Middle East, and Rest of World
1.6 Investment Momentum
1.7 Current Deployment Status and Commercial Readiness
1.8 Market Drivers and Challenges
1.9 Key Findings and Strategic Implications
2. INTRODUCTION
2.1 Definition and Classification of Quadruped Robots
2.1.1 Fully Legged Quadrupeds
2.1.2 Wheeled-Leg Hybrid Quadrupeds
2.1.3 Bioinspired Quadrupeds
2.2 Historical Evolution of Quadruped Robotics
2.2.1 From Hydraulic Prototypes to Electric Actuators
2.2.2 The MIT Cheetah Legacy
2.2.3 Boston Dynamics: BigDog to Spot
2.2.4 The Rise of Unitree and Chinese Hardware Manufacturers
2.3 Why Quadrupeds: Advantages Over Alternative Mobile Platforms
2.3.1 Quadrupeds vs Drones
2.3.2 Quadrupeds vs Wheeled Robots
2.3.3 Quadrupeds vs Tracked Robots
2.3.4 Quadrupeds vs Humanoid Robots
2.4 Key Enablers of the Rise of Quadrupeds
2.4.1 Li-ion Battery Breakthroughs and Cost Reductions
2.4.2 Transition from Hydraulic to Electric Actuators
2.4.3 Sensor Cost Reductions (LiDAR, Cameras, ToF)
2.4.4 Compute Improvements: The Nvidia Jetson Roadmap
2.4.5 Software and AI Maturation
2.5 Business Models
2.5.1 Robot-as-a-Service (RaaS)
2.5.2 Hardware Sales (Direct Purchase)
2.5.3 Platform Licensing and Software Subscriptions
3. TECHNOLOGY ASSESSMENT
3.1 Actuator Design and Locomotion
3.1.1 Quasi-Direct-Drive (QDD) Actuators
3.1.2 High-Ratio Harmonic and Planetary Gearbox Actuators
3.1.3 Rotary vs Linear Actuation
3.1.4 Backdrivability, Compliance, and the Terrain Trade-off
3.2 Sensors and Perception
3.2.1 LiDAR Systems
3.2.2 RGB and Depth Cameras
3.2.3 Time-of-Flight (ToF) Sensors
3.2.4 Inertial Measurement Units (IMUs)
3.2.5 Acoustic and Thermal Sensors
3.2.6 Gas Detection Sensors
3.2.7 Foot Force/Contact Sensors
3.3 Computing and Edge AI
3.3.1 Onboard Compute Architectures
3.3.2 Communication Buses
3.4 Power Systems and Battery Technology
3.4.1 Current Battery Specifications and Constraints
3.4.2 Power Density Improvements
3.4.3 Autonomous Docking and Charging
3.5 Software Architecture
3.5.1 The Control Loop
3.5.2 ROS and Open-Source Frameworks
3.5.3 Proprietary Software Stacks
3.5.4 Direct Motor Control vs Pre-Set Controllers
3.6 Autonomy and AI
3.6.1 Planning, Navigation, and Positioning
3.6.2 Reinforcement Learning and Sim-to-Real Transfer
3.6.3 Foundation Models for Robotics
3.7 Safety, Certification, and Cybersecurity
3.7.1 IP Ratings
3.7.2 ATEX/IECEx Explosion-Proof Certification
3.7.3 Cleanroom and Low-Particle Compliance
3.7.4 Cybersecurity and Data Sovereignty
4. BILL OF MATERIALS ANALYSIS
4.1 Quadruped BoM Structure and Cost Breakdown
4.2 Unitree Go2 BoM Deep Dive
4.2.1 Mechanical Architecture
4.2.2 Actuators (Motors, Gearboxes, Drives)
4.2.3 Sensors
4.2.4 Computing
4.2.5 Battery
4.2.6 Structure and Mechanical
4.3 Unitree B2 BoM Deep Dive
4.4 Western Quadruped BoM Estimates
4.5 China's Manufacturing and Supply Chain Cost Advantage
4.6 Component Cost Evolution Projections to 2037
5. APPLICATIONS AND END-USE MARKETS
5.1 Oil and Gas
5.1.1 Upstream Inspection (Offshore Platforms, Pipelines)
5.1.2 Downstream Inspection (Refineries, Petrochemical Plants)
5.1.3 Explosion-Proof Requirements and ATEX Zones
5.2 Semiconductor Fabrication
5.2.1 Fab and Subfab Inspection
5.2.2 Cleanroom Integration Challenges
5.2.3 Downtime Cost Avoidance
5.3 Data Centres
5.3.1 Electrical Yard Inspection
5.3.2 Hyperscaler Adoption Scenarios
5.4 Construction
5.4.1 Site Monitoring, Progress Tracking, and Digital Twin Creation
5.4.2 Terrain Navigation
5.5 Mining
5.6 Utilities and Energy Infrastructure
5.7 Security and Surveillance
5.7.1 Perimeter Patrol
5.8 Last-Mile Delivery and Logistics
5.8.1 Campus and Contained-Area Delivery
5.8.2 Warehouse and Fulfilment Centre Operations
5.9 Defence and Military
5.9.1 Reconnaissance and Surveillance
5.9.2 Payload Delivery in Contested Environments
5.9.3 EOD and CBRN Support
5.10 Agriculture
5.11 Search and Rescue / Disaster Response
5.12 Research and Education
6. THE QUADRUPED ECOSYSTEM
6.1 Ecosystem Architecture and Value Chain
6.2 Hardware Platform Providers
6.3 Autonomy and Model Vendors
6.4 System Integrators
6.5 Application Layer and Fleet Management
6.6 Component Supply Chain
6.7 Ecosystem Dynamics and Market Structure
6.7.1 Verticalisation vs Platform-Based Strategies
6.7.2 The Role of the Open-Source Research Community
6.7.3 Fragmentation Risk and the Hyperscaler Question
7. COMPETITIVE LANDSCAPE
7.1 Market Share Analysis
7.2 Competitive Positioning Map
7.3 Pricing Analysis
7.3.1 Western Pricing: RaaS (~$10K/month) vs Direct Purchase
7.3.2 Chinese Pricing Advantage (Up to 90% Lower at Consumer Tier)
7.3.3 Price Erosion Outlook 2027–2037
7.4 Product Specifications Comparison
7.5 Strategic Groupings
7.5.1 Vertically Integrated: Boston Dynamics, ANYbotics
7.5.2 Hardware-First / Ecosystem: Unitree, DEEP Robotics
7.5.3 Defence-Focused: Ghost Robotics
7.5.4 Consumer/Research Crossover: Xiaomi, Robot Era
7.6 Mergers, Acquisitions, and Partnerships (2020–2026)
7.7 Investment and Funding Landscape
8. MARKET FORECASTS 2027–2037
8.1 Global Market Revenue Forecast
8.2 Global Unit Shipment Forecast
8.3 Forecast by Application
8.3.1 Application Segment Analysis
8.4 Forecast by Region
8.5 Forecast by Robot Type
8.6 Forecast by Component
8.7 Total Addressable Market (TAM) Sizing
8.8 Average Selling Price Forecast
9. REGIONAL ANALYSIS
9.1 North America
9.1.1 United States (Defence, Tech, Energy)
9.1.2 Canada
9.2 Europe
9.2.1 Germany (Industry 4.0 and Smart Factories)
9.2.2 United Kingdom
9.2.3 Switzerland (ANYbotics, ETH Zurich Ecosystem)
9.2.4 Nordics (Oil and Gas, Offshore)
9.2.5 Rest of Europe
9.3 China
9.3.1 Government Policy, Subsidies, and the National Robotics Roadmap
9.3.2 Supply Chain and Manufacturing Advantages
9.3.3 Domestic Deployment and Export Markets
9.3.4 Security and Geopolitical Considerations for Western Buyers
9.4 Asia Pacific (ex-China)
9.4.1 Japan (Kawasaki, Sony)
9.4.2 South Korea (Hyundai/Boston Dynamics Synergies)
9.4.3 Australia (Mining Applications)
9.5 Middle East and Africa
9.5.1 Saudi Arabia and UAE (Oil and Gas, Smart City Deployments)
9.6 Rest of World
10. COMPANY PROFILES (29 COMPANY PROFILES)
11. APPENDICES
11.1 Glossary of Terms
11.2 Research Methodology
12. REFERENCES
LIST OF TABLES
Table 1. Global Quadruped Robot Market Revenue Forecast 2027–2037 (USD Million)
Table 2. Comparative Assessment: Quadrupeds vs Drones vs Wheeled Robots vs Tracked Robots vs Humanoid Robots
Table 3. Autonomy Level Deployment Status by Manufacturer (2026)
Table 4. Regional Market Summary
Table 5. Major Quadruped-Relevant Funding Rounds and Valuations (2024–2026)
Table 6. Summary of Market Drivers and Restraints
Table 7. Quadruped Robot Classification by Type, Locomotion, and Use Case
Table 8. MIT Cheetah Programme Timeline
Table 9. Unitree Product Evolution
Table 10. Quadruped Robotics Historical Development Timeline
Table 11. Detailed Performance Comparison: Key Parameters by Robot Type
Table 12. Sensor Cost Evolution
Table 13. Nvidia Jetson Compute Evolution for Robotics
Table 14. Business Model Comparison
Table 15. Actuator Architecture Comparison: QDD vs High-Ratio vs SEA
Table 16. LiDAR Specifications and Costs: Chinese vs Western Suppliers
Table 17. Compute Module Comparison for Quadruped Platforms
Table 18. Battery Specifications by Quadruped Model
Table 19. Autonomy Capabilities by Manufacturer
Table 20. IP Ratings and Safety Certifications by Quadruped Model
Table 21. Quadruped BoM Cost Distribution: Unitree Go2 vs Boston Dynamics Spot (% of total component cost)
Table 22. Unitree Go2 Pro Estimated Bill of Materials
Table 23. Unitree B2 Estimated Bill of Materials
Table 24. Estimated BoM Comparison: Spot vs ANYmal vs Unitree B2
Table 25. Cost Index Comparison: Chinese vs Western Quadruped Manufacturing (indexed to Unitree Go2 = 100)
Table 26. Projected Component Cost Reductions to 2037 by Category
Table 27. Oil and Gas Quadruped Deployment Case Studies
Table 28. Data Centre Inspection ROI Model
Table 29. Utility and Energy Infrastructure Use Cases and Savings Estimates
Table 30. Security Patrol TCO Comparison: Quadruped Robot vs Human Guard
Table 31. Military Quadruped Programmes by Country
Table 32. Quadruped Ecosystem Value Chain Map
Table 33. Quadruped Hardware Platform Comparison (All Major Commercial Models)
Table 34. System Integrator Capabilities and Partner Ecosystem
Table 35. Key Component Suppliers Exposed to Quadruped Growth
Table 36. Global Quadruped Market Share by Units Shipped (2023–2026e)
Table 37. Global Quadruped Market Share by Revenue (2023–2026e)
Table 38. Units Shipped 2025
Table 39. Competitive Positioning: Price vs Capability Matrix — Price, Capability and Certification
Table 40. Competitive Positioning: Price vs Capability Matrix — Ecosystem, Support and Value Scores
Table 41. Pricing Comparison by Model: Purchase Price, RaaS Rate, Annual TCO
Table 42. Full Product Specification Comparison (All Current Commercial Quadrupeds)
Table 43. Key M&A, Partnerships, and Strategic Alliances
Table 44. Funding Rounds, Valuations, and Investor Profiles for Key Companies
Table 45. Global Quadruped Robot Market Revenue 2027–2037 (USD Million)
Table 46. Global Quadruped Unit Shipments 2027–2037
Table 47. Revenue Forecast by Application Segment 2027–2037 (USD Million, Base Scenario)
Table 48. Revenue Forecast by Region 2027–2037 (USD Million, Base Scenario)
Table 49. Unit Shipment Forecast by Region 2027–2037
Table 50. Revenue and Unit Forecast by Robot Type 2027–2037 (Base Scenario)
Table 51. Component Market Size Forecast 2027–2037 (USD Million, Base Scenario)
Table 52. TAM Analysis by Vertical with Penetration Rate Assumptions
Table 53. ASP Forecast by Robot Category 2027–2037 (USD)
Table 54. North America Market Size and Growth 2027–2037 (USD Million, Base)
Table 55. Europe Market Size and Growth 2027–2037 (USD Million, Base)
Table 56. China Market Size, Domestic vs Export Revenue 2027–2037 (USD Million, Base)
Table 57. Middle East Quadruped Deployment Pipeline and Partnerships
Table 58. ANYbotics: ANYmal Product Line and ANYmal X Roadmap
Table 59. Boston Dynamics: Spot Product Specifications and Pricing
Table 60. FieldAI: Funding, Deployments, and Partner Platforms
Table 61. Nvidia Corporation Products / Technology
Table 62. Ouster: product specifications
Table 63. Unitree: Full Product Line Specifications
LIST OF FIGURES
Figure 1. Unitree Go2 Pro quadruped robot
Figure 2. Global Quadruped Robot Market Revenue by Scenario 2027–2037 (USD Million)
Figure 3. Global Quadruped Unit Shipments by Robot Type 2027–2037
Figure 4. Revenue by Application Segment, 2027 vs 2037 (USD Million, Base Scenario)
Figure 5. ANYBotics, An ANYmal passing through a narrow corridor
Figure 6. Jueying X30 Series
Figure 7. Lynx M20 robot
Figure 8. Ghost Vision 60
Figure 9. PUDU D5 Series quadruped
Figure 10. Unitree Go2 Robot Dog
Figure 11. Unitree B1
Figure 12. Unitree Robotics
Figure 13. AlphaDog
Figure 14. CyberDog
More Publications
The Global Market for Redox Flow Batteries 2024-2034
US$ 1,250.00
February 2024
136 pages
The Global Market for Radiation Detection Equipment and Materials 2023-2033
US$ 1,250.00
August 2023
105 pages
Nanotechnology Industry and Market Review 2017-2018
US$ 325.00
February 2018
270 pages
The Global Carbon Nanotubes Market 2027-2037
US$ 1,500.00
September 2026
458 pages
Graphene Investment and Pricing Report 2017
US$ 665.00
August 2017
212 pages

