Tea Market: Current Scenario across Top Producing Countries
02 Mar 2018 • by Natalie Aster

Having its roots in China, today tea is the second most consumed beverage from pole to pole after water owing to a wide choice of available tastes, flavors and types, and valuable dietary properties. This natural beverage contains vitamins, antioxidants, minerals, and various amino acids, therefore, drinking tea provides undeniable health benefits: it helps consumers to strengthen their immunity, lower cholesterol levels, spur metabolism, prevent cancer, reduce risks of dental decay and diabetes, and many more. Besides, due to small caffeine content, tea is recognised as a mild stimulant preventing fatigue. The majority of consumers has developed drinking tea as a habit, thus, contributing to the world’s market growth. Other important tea market growth drivers include shifting consumer preferences towards healthier beverages, and rising demand for ready-to-drink tea. As for types, black tea grabs a share of nearly 60%, whilst green holds a 30% share; the remaining market share is split between red, herbal, white, and other types of tea.
During 2010-2016, the global tea production volume enjoyed steady growth at a CAGR of nearly 5%: from around 4.07 million metric tons in 2010 to appr. 5.6 million metric tons in 2016. By the year 2022, the world’s tea production volume may climb to 7.2 million metric tons.
Global tea production and exports during 2010-2016 (in million metric tons).jpg)
Presently, China, India, Kenya, Sri Lanka, and Vietnam are the top five tea producing countries worldwide. China alone accounts for around a fifth of the world’s total output volume.
Meantime, global tea exports were on a downward trend during 2013-2016. In 2016, only 32% of the total tea production volume was exported. This is mainly explained by the stagnant demand in most non-producing countries. However, the situation is set to improve in the short run due to enhancing interest from some emerging countries on the back of rising disposable incomes.
Top global tea importers in 2016 (in USD million).jpg)
Along with the steadily rising demand for tea worldwide, the world’s market continues to gain momentum at a swift pace. In 2017, the value of the world’s tea market went beyond the USD 12.8 billion. During 2017-2025, the worldwide tea market is forecast to continue keeping to an upswing trend rising at a CAGR of over 5% and will likely touch USD 20 billion by the concluding forecast year. Amid regions, the highest CAGR is anticipated in APAC – about 6.8%.
China Remains Unrivalled Global Leader in Tea Production
China has remained at the forefront of the worldwide tea industry for centuries. At present, the country produces the largest volume of tea globally. Moreover, China ranks the world’s top tea exporter. Yunnan, Zhejiang, and Guangdong are the key tea producing provinces in the country; this is majorly due to favourable weather conditions for tea cultivation and rich tea resources. These three provinces together account for above half of the total domestic tea industry revenues.
During the past several decades, the Chinese tea industry has exhibited a considerable increase, mainly encouraged by the escalating demand in both the international and domestic market. As of 2016, the total tea production volume in China stood at above 2.4 million tons. In that year, China grabbed a 40% share of the world’s total tea output volume. The revenue generated by the Chinese tea market picked up at a 9.4% CAGR during 2011-2016.
Exports of tea from China have also registered a large increase over the past 10 years. In 2006, the country’s government has abandoned the system of licensing restrictions and quotas related to tea exports, therefore, the number of tea exporters in the country has exhibited a remarkable uptake alongside a few state-owned companies. As of 2016, China exported nearly 331.8 thousand tons of tea, which was equal to around USD 1.5 billion. In that year, China grabbed a 21% share of the world’s total tea supply. The top destinations of the Chinese tea exports include Vietnam, Morocco, the USA, Ghana, and Senegal.
Major Importers of Tea from China, 2016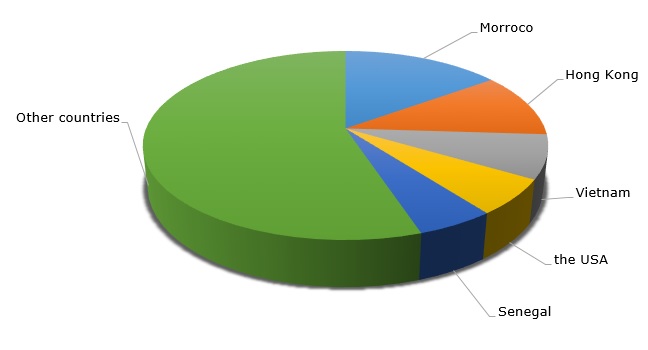
India Tea Market to See Price Recovery in 2018
India ranks second largest tea producer worldwide. The country’s share of the world’s total tea output volume is estimated at around 26%. Besides, India boasts one of the most expansive domestic tea markets, and only one-fourth of the country’s tea production goes for exports. Still, this country holds a share of over 10% in the world’s total tea exports. In 2017, the country’s tea exports volume reached 240.7 million kilogrammes registering an 8.2% YoY increase. As for the value, the Indian tea exports added 5.9%.
The year 2017 was not very successful for the Indian tea industry: the overall crops grew by only 1.4% YoY over the first 10 months of 2017, majorly driven by the uptake in South India region, meantime, crop levels in North India (accounting for an 80% share of the total domestic tea output) remained at a marginal deficit after a considerable decline in September 2017.
However, the outlook for 2018 is rather optimistic. The underproduction in the world’s tea market is supposed to make a favor to India’s tea industry in the current year after a weak performance in 2017. Moreover, increasing domestic demand along with higher exports is likely to encourage price recovery in 2018 after a marginal decline registered in the past year owing to a number of cost pressures including changes in the tax regime, bad weather, etc. Furthermore, the decline in the Kenyan tea exports has boosted the exports from India.
Leading importers of Indian tea in 2015/16 on the basis of value (in billion INR)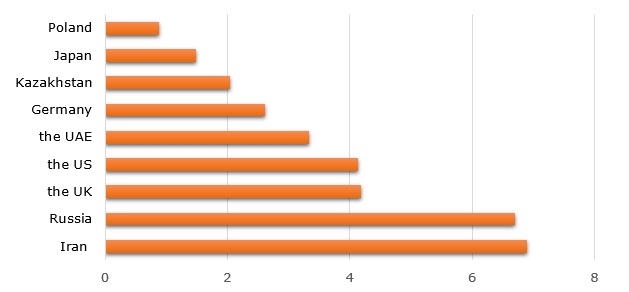
Kenya Registered Exports Volume Drop Across Many Major Destinations in 2017
Kenya is the dominant tea producer in Africa and the third leading tea producer across the globe. The tea industry is the key contributor to foreign exchange earnings in Kenya.
During January-October 2017, exports of tea from Kenya dropped by nearly 15% and reached 351 million kilogrammes, this was majorly due to a prolonged drought period. Considerable declines of the Kenya tea export supply were registered across many important export destinations: Kenya’s tea exports to the UK decreased by 12%, to Egypt – by 35%, to the UAE – by 20%. However, the number of export destinations for the Kenyan tea increased from around 35 countries in 2016 to 42 in 2017. Pakistan maintained the leading position in terms of the imported volume of the Kenyan tea. Kenya has always relied on the established export destinations, however, now the trend is shifting to new markets to improve the national tea industry performance.
Kenya tea exports by country in FY 2016/2017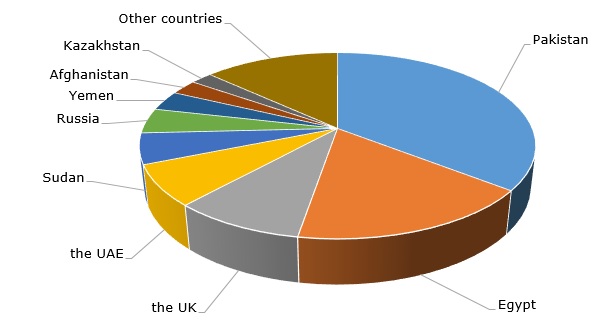
However, despite a fall in Kenya’s tea production and exports, the outlook for the revenues of the country’s tea industry is rather optimistic. The average tea price in 2017 was around USD 2.93 per kilogramme in comparison to USD 2.2 in the previous year, this is attributed to the strong demand for the Kenyan black tea which is recognised as the best quality black tea worldwide.
2018 May Be Another Good Year for the Tea Industry in Sri Lanka
The tea industry in Sri Lanka experienced a 6% YoY crop increase in 2017 in spite of a range of restraints, including a temporary ban on tea exports to Russia and a remarkable fall in exports to Syria and Iran. Meanwhile, despite certain geopolitical conditions in MENA, approximately 53% of the total Sri Lankan exports were supplied to this region, with Lebanon, Jordan, and Iran being the top consumers. Furthermore, lucrative opportunities emerging in new markets have paved the way for a positive outlook for the Sri Lankan tea market in 2018.
The production volume of tea in Sri Lanka went up by almost 5% in 2017 and exceeded 307 million kilogrammes. The highest growth rate was registered in the CTC and green tea sectors – around 16% and 13% respectively.
Meantime, the tea exports of Sri Lanka in 2017 remained almost at the same level if compared to the previous year and were estimated at appr. 288.9 million kilogrammes. However, the revenue generated from the tea exports increased by over 26% in local currency terms, this was majorly due to higher tea prices in the wake of the global shortage of black tea and also the shortfall in Sri Lanka’s tea crops.
In 2017, Turkey was the key importer of the Sri Lankan tea, closely followed by Iraq. Other leading Sri Lankan tea consumers were Russia, Iran, and the UAE.
Top 10 importers of Sri Lanka tea in 2017 (in million kg).jpg)
In 2018, the Sri Lankan tea market is set to maintain healthy growth spurred by a shortfall of global crops, devalued national currency, and ongoing economic recovery, which would maintain healthy prices.
© MarketPublishers.com, 2018
Analytics & News