The Future of Yellow Phosphorus in China
China owns the largest capacity and output of yellow phosphorus in the world. However, Overcapacity has emerged as an eminent problem in Chinese yellow phosphorus industry in recent years. For example China’s capacity in 2008 is about double the size of the global demand, which is only about 800,000-900,000 tonnes every year. That suggests a very low operating rate of China’s yellow phosphorus industry about one third of its capacity during 2003-2008. What are reasons for the low operating rate, or why Chinese yellow phosphorus producers expand their capacity to such a large scale?
In China, like several years ago, most yellow phosphorus was consumed by thermal phosphoric acid and phosphorus trichloride in 2008. However, the consumption structure of yellow phosphorus is changing every year. The yellow phosphorus consumption by thermal Yellow phosphorus, the second largest consumption area of phosphorus ore, constitutes about 15% of phosphorus ore consumption in China. And phosphorus ore is an irreplaceable and non-renewable resource and closely related to people’s life,
China owns the largest capacity and output of yellow phosphorus in the world. However, overcapacity has emerged as an obvious problem in Chinese yellow phosphorus industry in recent years. For example China’s capacity in 2009 is about double the size of the domestic demand. What’s more, China has begun to restrict export of yellow phosphorus, which aggravates the overcapacity situation. That suggests a very low operating rate of China’s yellow phosphorus industry of about 40%~ 50% in recent years. What are reasons for the low operating rate, or why Chinese yellow phosphorus producers expand their capacity to such a large scale?
After few years’ structural readjustment and elimination in yellow phosphorus industry, China’s yellow phosphorus production and phosphorous chemical industry chain is much more reasonable now. How did Chinese make these achievements? What are the details of China’s yellow phosphorus industry development? What are the situation of energy consumption, waste emission and utilization situations in Chinese yellow phosphorus production?
Chinese government had implemented policies to restrict export and exploitation of phosphorus ore, export and production of yellow phosphorus since 2005. Currently in 2010, the last year for China’s 11th National Economic and Social Development (2006-2010), the development of phosphorus production has witnessed the major turning point of the industry. What is the trend of electricity price for yellow phosphorus production? What is the current production cost of yellow phosphorus and how is the production cost consisted of?
China used to export large volume of yellow phosphorus until 2008, but currently the export is limited since 2008 by increasing the tariff to 120% as highest. Though the tariff has been reduced in 2009, but the export didn’t recovery, what is the trend of China’s yellow phosphorus export?
In the past of China, most yellow phosphorus was consumed by thermal phosphoric acid and phosphorus trichloride. However, the consumption structure of yellow phosphorus is changing every year. The yellow phosphorus consumption by thermal phosphoric acid has been shrinking by consumption share in recent years, while the share of yellow phosphorus in phosphorus trichloride has been increasing. What other changes have taken place to Chinese yellow phosphorus consumption and what have driven such changes to happen? How do the limitation of phosphorus detergent and development of wet-process phosphoric acid impact consumption of yellow phosphorus?
The price of Chinese yellow phosphorus, closely related to supply/demand dynamics, changing with global economic environment, seasons, national policy etc., has experienced great fluctuations in 2008, with the highest reaching USD3,504/t and the lowest dropping to USD1,606/t. What are the price changes of yellow phosphorus in 2009 and 2010?
It is estimated that it will take 30 years to exploit the remaining yellow phosphorus in China, so China is adjusting industrial structure of yellow phosphorus for saving phosphorus resource. What’s the influence on resource supply, manufacturers, capacity and output of Chinese yellow phosphorus caused by adjusting industrial structure? What is the trend of resource tax levied on phosphorus ore?
In this report, you can find the answers to all the above questions.
Besides, this report also tries to find answers to the following questions:
- What is the resource supply situation in China for yellow phosphorus industry?
- How is the production situation of Chinese yellow phosphors? The production part covers capacity & output, manufacturers’ situation, price, existing problems, cutting edge technologies, comparison of production cost, competitive strategy, etc.
- How is yellow phosphorus consumed and what changes have taken place to the consumption in recent years?
- What are the development trends about capacity, output, manufacturers, resource supply, consumption situation in 2010-2019, based on large number of first-hand information and advanced forecast method?
- What is IE analysis of Chinese yellow phosphorus in 2009?
- What is SWOT analysis of top 5 manufacturers of Chinese yellow phosphorus industry in Sep. 2010?
With this report, you will gain a complete and in-depth impression of Chinese yellow phosphorus industry in its past, present and future.
INTRODUCTION AND METHODOLOGY
1 RESOURCE SUPPLY OF YELLOW PHOSPHORUS IN CHINA
1.1 Electricity
1.2 Coke
1.3 Phosphorus ore
1.3.1 Distribution & reserves
1.3.2 Exploitation & consumption
1.3.3 Policy
1.3.4 Import & export
2 SUPPLY AND DEMAND OF YELLOW PHOSPHORUS IN CHINA
2.1 Supply situation
2.1.1 Summary of supply situation, 2010- H1 2013
2.1.2 Geographical distribution & producers
2.1.3 Problems existing in yellow phosphorus industry
2.1.4 Improvements in China’s yellow phosphorus production
2.1.5 Cutting edge technologies
2.1.6 Competition strategy
2.2 Circulation
2.2.1 Export situation
2.2.2 Price
2.2.2.1 Price changes in the past
2.2.2.2 Future forecast
2.3 Consumption situation
2.3.1 Consumption summary
2.3.1.1 By volume
2.3.1.2 By region
2.3.1.3 By end use
2.3.2 Market segmentation
2.3.2.1 Thermal phosphoric acid
2.3.2.1.1 Consumption situation
2.3.2.1.2 Overview of thermal phosphoric acid industry
2.3.2.1.3 Major end users
2.3.2.2 Phosphorus trichloride
2.3.2.2.1 Consumption situation
2.3.2.2.2 Overview of phosphorus trichloride industry
2.3.2.2.3 Major end users
2.3.2.3 Other industries (phosphorus pentasulfide, phosphorus pentoxide and sodium hypophosphite, etc.)
3 FORECAST ON YELLOW PHOSPHORUS DEVELOPMENT IN CHINA, 2013-2017
3.1 Key factors influencing yellow phosphorus development
3.2 Forecast on yellow phosphorus industry
3.2.1 Resource supply forecast
3.2.2 Supply forecast
3.2.3 Demand forecast
4 CONCLUSION
5 CONTACT INFORMATION OF MAJOR PRODUCERS IN CHINA
Table 1.2-1 Export tariff on coke in China, 2006-2013
Table 1.3.1-1 Reserves of phosphorus ore in main provinces, 2012
Table 1.3.2-1 Evaluation on years and cost of exploiting remaining Chinese phosphorus
Table 1.3.3-1 Export quota for phosphorus ore in China, 2009-2013
Table 1.3.3-2 Related policies about integration of phosphorus chemical industry
Table 1.3.3-3 Related policies about phosphorus ore mining in China
Table 2.1.2-1 Production situation of yellow phosphorus in Yunnan, 2008-2012
Table 2.1.2-2 Main manufacturers of yellow phosphorus in Yunnan, 2008-H1 2013
Table 2.1.2-3 Production situation of yellow phosphorus in Sichuan, 2008-2012
Table 2.1.2-4 Main manufacturers of yellow phosphorus in Sichuan, 2008-H1 2013
Table 2.1.2-5 Production situation of yellow phosphorus in Guizhou, 2008-2012
Table 2.1.2-6 Main manufacturers of yellow phosphorus in Guizhou, 2008-H1 2013
Table 2.1.2-7 Production situation of yellow phosphorus in Hubei, 2008-2012
Table 2.1.2-8 Main manufacturers of yellow phosphorus in Hubei, 2008-H12013
Table 2.1.5-1 Content of tail gas in yellow phosphorus
Table 2.1.5-2 Substances and their concentration in yellow phosphorus waste water
Table 2.1.5-3 Comparison of settlement-oxidation method and closed-circuit method
Table 2.1.5-4 Some examples of utilization of tail gas
Table 2.1.5-5 Some examples of utilization of slag
Table 2.1.6-1 Manufacturing cost of yellow phosphorus in China, June 2013
Table 2.2.1-1 Export tariff and export rebate situation of yellow phosphorus in China, 2008 to now
Table 2.2.1-2 Export of yellow phosphorus in China by month, 2010-2013 (Jan.-July)
Table 2.2.1-3 Main export destinations of yellow phosphorus in China, 2013 (Jan.-July)
Table 2.2.1-4 Main export destinations of yellow phosphorus in China, 2012
Table 2.2.1-5 Main export destinations of yellow phosphorus in China, 2011
Table 2.2.1-6 Main export destinations of yellow phosphorus in China, 2010
Table 2.2.1-7 Main exporters of yellow phosphorus in China, 2013 (Jan.-July)
Table 2.2.1-8 Main exporters of yellow phosphorus in China, 2012
Table 2.2.1-9 Main exporters of yellow phosphorus in China, 2011
Table 2.2.1-10 Main exporters of yellow phosphorus in China, 2010
Table 2.3.1.1-1 Production situation of yellow phosphorus in China, 2008-2012
Table 2.3.1.2-1 Yellow phosphorus consumption situation by province in China, 2012, tonne
Table 2.3.2.1.2-1 Competition among different phosphoric acids in China
Table 2.3.2.1.2-2 Usage of different phosphoric acid
Table 2.3.2.1.3-1 Main thermal phosphoric acid producers in China, 2012
Table 2.3.2.2.3-1 Main phosphorus trichloride producers in China, 2012
Table 5-1 Main manufacturers of yellow phosphorus in China, H1 2013
The total capacity of yellow phosphorus in China reached as high as xxx t/a in 2013, showing a small growth at a CAGR of xxx% from 2009 to 2013. Overcapacity has been a big issue in the industry in recent years. The operating rate of manufacturers averaged only xxx% during 2009-2013.
Capacity and Output of Yellow Phosphorus in China, 2009-2013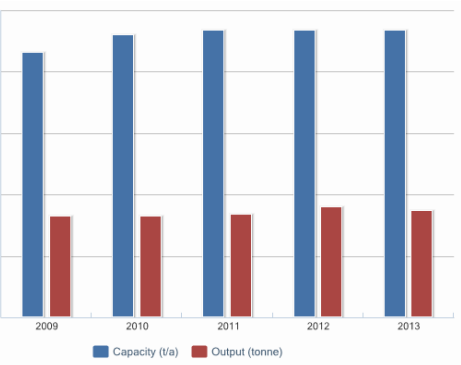
There are xxx manufacturers each possessing a capacity of over xxx t/a and their total capacity was xxx t/a in 2013, almost xxx% of the total in China.
Output Structure of Yellow Phosphorus in China by Province, 2009-2013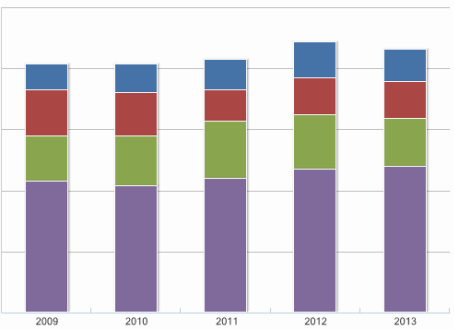
Problems existing in yellow phosphorus industry
After years of eliminating unqualified production facilities, both the number of yellow phosphorus producers and small-scale furnaces have decreased greatly in China compared with the amount in 2008.
The industry chain of yellow phosphorus is phosphorus resources – yellow phosphorus – phosphorus chemicals. But most of the manufacturers of phosphorus chemicals in China are distributed in coastal regions, while those of yellow phosphorus are located in the inland. This will bring more transportation cost to the manufacturers as well as burden the country's transportation system.
After a upgrading of yellow phosphorus industry in China, the technology for production has been improved obviously, and the energy consumption and pollution emission have been reduced greatly. However, there are still some disadvantages in industry.

