Production and Future Development of Niacin in China/industry publication

The report will process factor analysis of increasing agricultural produces prices and list five main reasons influencing change in price, such as:
- Total costs
- Transportation cost and multifarious circulation links
- Minimum cereal purchasing prices
- Urbanization and change in consumption structure
- Adverse weather condition and natural disaster
2 METHODOLOGY
3 SITUATION OF NIACIN INDUSTRY
4 SITUATION OF PRODUCTION IN CHINA
4.1 Domestic production of Niacin, 2011-2014
4.2 Domestic producers of niacin, 2011-2014
4.3 Price of niacin in China, 2010-June 2014
5 PRODUCTION TECHNOLOGY
6 RAW MATERIALS OF NIACIN
6.1 Production situation of raw materials in China, 2011-2013
6.2 Producers of raw materials in China
7 APPLICATION OF NIACIN
7.1 Application in feed
7.2 Application in pharmaceuticals
7.3 Application in food and others
8 OUTLOOK OF CHINA NIACIN INDUSTRY IN COMPARISON WITH VITAMIN C
8.1 Comparison from policy, technology, raw material, and supply and demand
8.2 Forecast on future of niacin industry in China
Table 2-1 Exchange rate between USD and RMB, 2004-June 2014
Table 4.2-1 Capacity of niacin producers in China, 2011-2014, t/a
Table 6.2-1 Capacity and output of 3-picoline producers in China, 2011-2013
Table 6.2-2 Capacity and output of 3-cyanopyridine producers in China, 2011-2013
Table 7.3-1 Recommended dosage of niacin added into different kinds of food
Table 8.1-1 Similarities between the development of niacin and that of Vitamin C in China
Table 8.1-2 Unit consumption of raw materials of niacin and Vitamin C
Table 8.1-3 Capacity of 3-picoline, 3-cyanopyridine and niacin in China, 2011-2013
Table 8.1-4 Capacity of Sorbitol and Vitamin C in China, 2011-2013
Table 8.1-5 National policies on niacin and Vitamin C in China
The investment fever started to cool down since 2011, as a result of the decreasing price driven by the intensifying competition and relatively slack market of feed, the largest end use of niacin.
As the global producers have shifted their production plants to China, China has now been the major production country for almost all the vitamins, except niacin. The majority of niacin supply in the world market has been provided by countries other than China, though China is also an important niacin producer with Lonza Group having set up niacin plants in China as early as the late 1990s.
China's niacin output reached XXX tonnes in 2013. Lonza Guangzhou Nansha Ltd. is the dominant player, followed by several small local players trying to snatch market share from this leading player.
Though raw material supply is no longer the bottleneck for China's local players' niacin production, the XXX is the key barrier for them to win the competition with global producers like Lonza Group.
Capacity and Output of Niacin in China, 2008-1H 2014, T/A and Tonne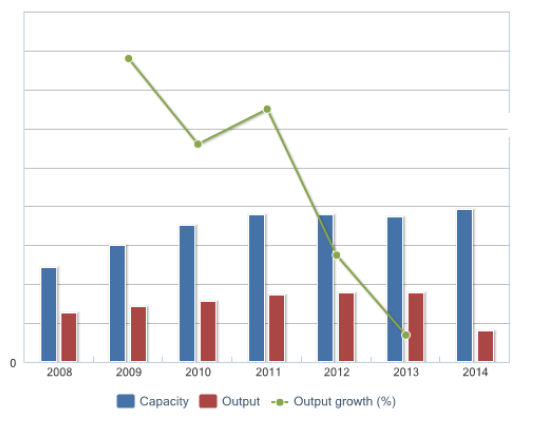
The production launch and expansion of pyridine, with which 3-picoline-the raw material for niacin production-is usually co-produced, by Nanjing Redsun Co., Ltd. in 2006 and 2008, has solved the raw material supply shortage, enabling Chinese producers to launch niacin production one after another since 2008.
However, different from the investment fever in the three years from 2008 to 2010, China's niacin output and capacity have XXX since 2011, staying at around XXX tonnes and XXXt/a respectively. After the output hike in 2011 to XXX tonnes from 15,500 tonnes in 2010, China's niacin output in 2012 grew by XXX% and it XXX in 2013. China's niacin capacity utilization rate has stayed below XXX% since 2011.
The growth of feed industry, the largest end use of niacin, is expected to recover with robust demand in 2014 in both China and the world. This will be good news for niacin producers. However, with the 2,000t/a capacity increase by Nantong Acetic Acid Chemical Co., Ltd. (Nantong Acetic Acid) in early 2014 and the 5,000t/a niacin plant to be launched by Vertellus Specialty Chemicals (Nantong) Co., Ltd. (Vertellus Nantong) in October 2014, overcapacity will remain severe and competition will become more intense in China's niacin market. Accordingly, with technology unlikely to improve in a short term and relatively stable demand from downstream industries, the profitability of niacin producers in China is not expected to improve soon.

