Ethylene Dichloride (EDC) Global Supply Dynamics to 2020 - US Sustains the Leading Position
28 Oct 2010 • by Natalie Aster

Ethylene Dichloride (EDC) Global Supply Dynamics to 2020 - The US Sustains the Leading Position in Global Production by GBI Research, is an in-depth report on the supply side of the global EDC industry. The research presents detailed analysis and forecasts of the major economic and market trends affecting the EDC supply in the major regions of the world.
Ethylene Dichloride study contains capacity, production analysis and forecasts, drivers and restraints, capacity analysis by key feedstock, by production process and by technology, price analysis for feedstock ethylene and a capacity share analysis of the major producers in all the regions of the world. In addition, it includes capacity and production forecasts for the major countries in all geographies. Overall, the report presents a comprehensive analysis of the global EDC market covering all the major parameters.
Report Details:
Published: Nov, 2010
Pages: 141
Price: US$ 3,500.00
Report Sample Abstracts:
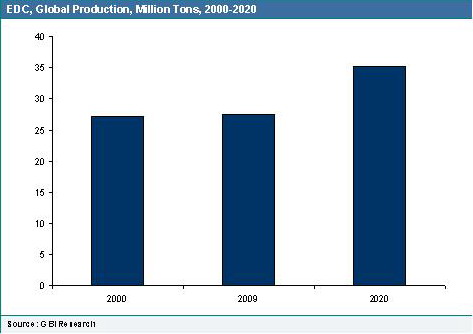
Global EDC production in 2000 was 27.2 million tons. It grew at a CAGR of 0.1% from 2000 to 2009. Global EDC production in 2009 was 27.5 million tons. Global EDC production is expected to grow at a CAGR of 2.3% from 2009 to 2020.
The following graph shows the global EDC production from 2000 to 2020.
North America had the Largest Production Capacity in 2009
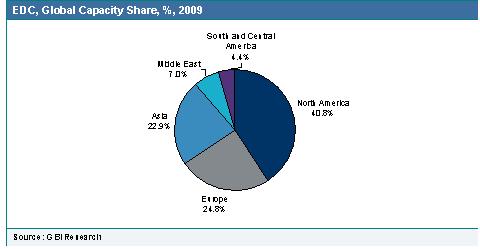
Global EDC capacity in 2009 was 42.6 million tons. North America had the largest capacity of 17.4 million tons and a share of 40.8%. Europe had a capacity of 10.6 million tons and a share of 24.8% followed by Asia with a capacity of 9.7 million tons and a share of 22.9%. The Middle East had the capacity of 3 million tons and a share of 7% followed by South and Central America with a capacity of 1.9 million tons and a share of 4.4%.
The following graph shows the global EDC capacity share of different regions in 2009.
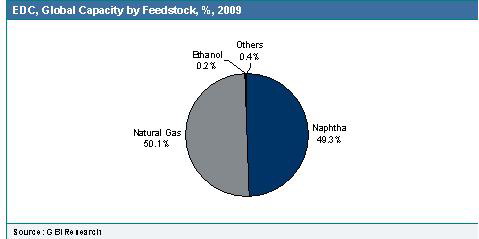
Global EDC capacity in 2009 was 42.6 million tons. 50.1% of the global capacity was based on natural gas for feedstock while 49.3% of global capacity was based on naphtha for feedstock. 0.2% of the capacity was based on ethanol and 0.4% capacity was based on other feedstocks.
The following graph shows the global EDC capacity analysis by feedstock in 2009.
To order the report or ask for sample pages contact [email protected]
Contacts
MarketPublishers, Ltd.
Mrs. Alla Martin
Tel: +44 208 123 2220
Fax: +44 207 900 3970
[email protected]
MarketPublishers.com
Analytics & News