Natural vs. Synthetic Rubber: Key Market Trends & Statistics
31 Jul 2018 • by Natalie Aster
LONDON – Rubber falls into the category of elastomer type polymers able to retain its original shape after deformation. Rubber has a coiled form in the resting state. The term rubber encompasses macromolecular substances of synthetic and natural origin. The natural compound is derived from the milky-white fluid (a.k.a. latex) gathered from a tropical rubber tree and is commonly known as natural rubber. Meanwhile, synthetic rubber is an artificially-manufactured elastomer resembling closely its natural analogue in different features.
Owing to a range of such unique characteristics as resiliency, distensibility, moisture resistance, amid others, rubber became extremely popular and found an array of applications across various industrial fields.
The scarcity of rubber trees plantations around the globe has made it difficult to satisfy the needs of the ever-increasing population. In lite of this situation, synthetic rubber has emerged as a good alternative to natural one, and people have readily accepted it. Moreover, certain difficulties associated with the transportation of natural rubber over long distances have also pushed synthetic counterparts to the fore. Presently, nearly 60% of the world’s total rubber output is produced synthetically.
PRODUCTION
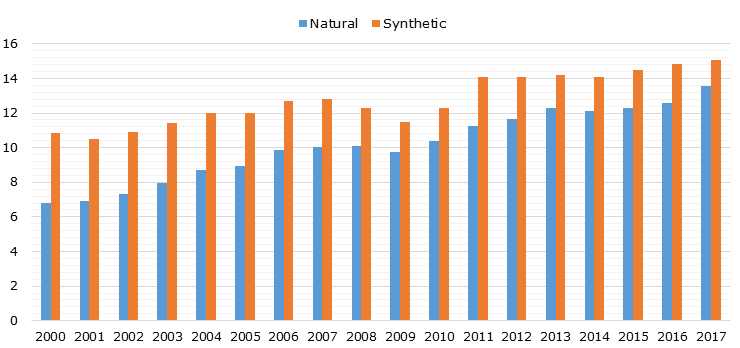
The world’s production of rubber has demonstrated an incremental increase since 2009, except for a slight decline in 2014. Last year, the global output volume of rubber added above 1.14 million metric tons (MMT) YoY and went beyond 28.55 MMT. In the same year, the worldwide production volume of natural and synthetic rubber totaled at around 13.5 MMT and 15.05 MMT, respectively.
Global production volume of natural and synthetic rubber between 2000 and 2017 (in MMT)
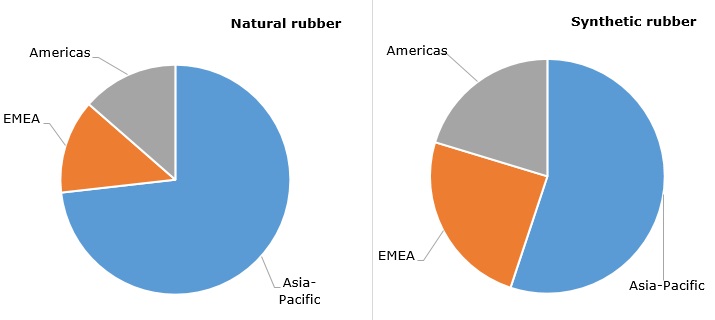
Geographically, Asia-Pacific is the unrivalled leader in terms of both natural and synthetic rubber production. This region captures a bulk share of 91% of the world’s total output volume of natural rubber despite the fact that rubber trees are native to the South American region. Meantime, Americas account for just less than 3% of the worldwide production. In 2017, Asia-Pacific produced nearly 12.3 MMT of natural rubber.
Structure of natural rubber production during 2014-2017, by region (in MMT)
.jpg)
The top spot on the list of the world’s leading natural rubber producing countries is held by Thailand with the annual output volume of above 4.3 MMT, which is equal to appr. 35.6% of the world’s total production volume. Thailand is also the dominant exporter of natural rubber on the global arena. Over 90% of rubber harvested in Thailand goes for export purposes, thus, making a great contribution to the country’s GDP.
The second and third positions in terms of natural rubber production are held by Indonesia and Malaysia, accounting for shares of nearly 27% and 8.8%, respectively. The major part of rubber harvested in these countries is also exported abroad.
Other prominent natural rubber producers comprise China, India, and Vietnam.
Leading natural rubber producers, 2017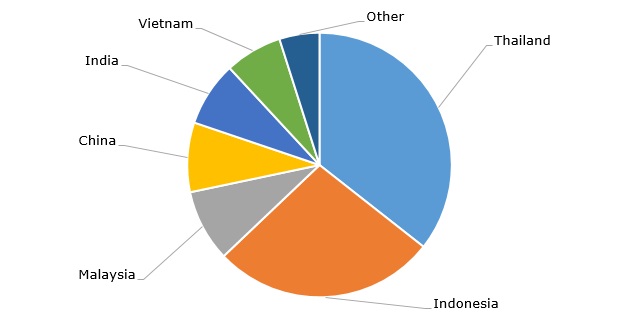
As for synthetic rubber production, Asia-Pacific grabs a share of slightly over 51% in the world’s total output, with China holding the lion’s share of the regional market. Meantime, other remarkable synthetic rubber producing regions – EMEA and Americas capture shares of appr. 27.8% and 20.4%, respectively.
Structure of synthetic rubber production during 2014-2016, by region (in MMT)
.jpg)
The synthetic rubber production is propelled by the constantly escalating demand from a broad spectrum of industrial and consumer applications. Presently, a great number of companies is involved in the manufacturing of synthetic rubbers. Some of the most prominent market players comprise ARLANXEO, Sinopec, KKPC, PetroChina, and TSRC, amidst others.
10 dominant companies engaged in synthetic rubber manufacturing, by production capacity, 2016 (in MMT)
.jpg)
CONSUMPTION
Spurred by the strong demand from the key end-use industries, the consumption of rubber has witnessed a steady upturn worldwide over 2009-2017. Last year, the volume of the global rubber consumption gained 910,000 metric tons YoY and surpassed 28.41 MMT. Synthetic rubber held a chunk of appr. 53% of the total rubber consumption volume.
Global consumption volume of natural and synthetic rubber over 2005-2018 (in MMT) .jpg)
Amid regions, Asia-Pacific makes the largest contribution to the growth of the world’s rubber consumption. It is the dominant consumer of both synthetic and natural rubbers. In 2016, Asia-Pacific consumed nearly 9.21 MMT of natural rubber and 8.23 MMT of synthetic rubber. The highest growth rate of rubber consumption in the coming years is projected in the Asia-Pacific region.
Structure of global rubber consumption by regions, 2016
The largest rubber consumption volumes are registered in such countries as China, Indonesia, Vietnam, India, and Thailand.
China ranked as the world’s leading consumer of rubber in 2016 by far outpacing other countries, and it is set to maintain the leading position in the years ahead. As for natural rubber, the country consumes about 37% of the world’s total volume. Appr. 80% of China’s natural rubber consumption volume go for the manufacturing of tires. The country is also a heavy synthetic rubber consumer.
Top natural rubber consumers globally, 2015-2016 (in MMT)
.png)
Amid synthetic rubber types, styrene butadiene rubber (SBR) boasts the highest consumption volume across the globe owing to its unique properties and a host of applications. This product segment will likely stay in the lead in the next few years. However, the highest growth rates in the offing are anticipated in such product categories as nitrile butadiene rubber (NBR) and isobutylene-isoprene rubber (IIR).
MARKET OUTLOOK
The world’s rubber market is anticipated to continue following an upward trend in the short-run, exhibiting growth at a modest CAGR between 4-5%. The rapidly-rising global appetite for synthetic rubbers is slated to fuel the global synthetic rubber market to go up from USD 28.88 billion in the year 2017 to exceed USD 37.8 billion by late 2022.
As about 75% of the world’s total rubber production (both synthetic and natural rubber) is used in the manufacturing of tires, therefore the constantly mounting demand from the automotive industry is likely to act as one of the major growth engines for the rubber market. Besides, the rising use of rubbers in different non-tire applications in the automotive sector will create further growth opportunities. Another significant driver of the worldwide rubber market is the escalating demand from the rapidly-expanding construction industry. Moreover, the surging consumption of synthetic rubbers in the manufacturing of athletic footwear and some other industrial sectors will also add to the market growth.
The Asia-Pacific region is set to maintain the leading position in terms of both production and consumption of rubber. Furthermore, the Asia-Pacific rubber market is predicted to expand at the fastest pace in the offing.
© MarketPublishers.com, 2018
Analytics & News