Global Fish Market: Key Facts & Statistics to Know in 2018
13 Jul 2018 • by Natalie Aster

LONDON – Fish has long been viewed as a vital staple of the human diet. It is an essential source of omega-3 fatty acids and proteins which provides an array of health benefits. It is widely thought, that eating fish is good for reducing tissue inflammation, improving cardiovascular health, and even preventing mental decline.
Besides, fish is also the top traded food commodity around the world, supported by a considerable hike in the aquaculture sector, which has been the most rapidly-expanding food production sector during the last 20 years.
PRODUCTION
The world’s total production volume of fish (fisheries + aquaculture) witnessed a steady upturn during 2007-2017 registering a CAGR of 2-3,5%. In 2016, the volume of the global fish production went beyond 170 million metric tons, whilst in 2017 it came to 174 million metric tonnes.
World’s fish production volume during 2007-2017 (in million metric tons) 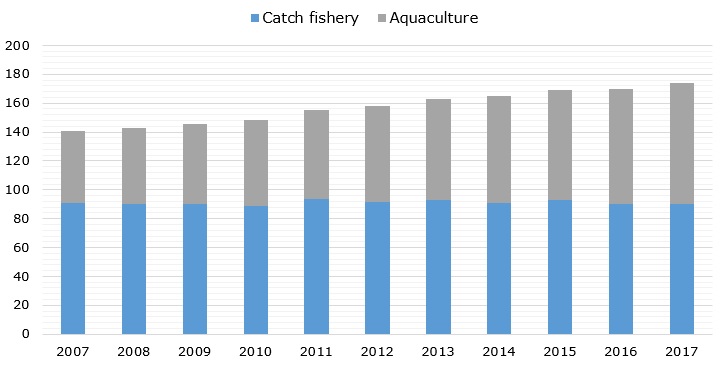
Sustainable growth of the fish production over 2007-2017 is majorly attributed to the expanding aquaculture sector, that already provides almost half of the fish people eat today. Meantime, the volume of the catch fishery remained almost at the same level during the reviewed period. In 2016, aquaculture accounted for appr. 47% of the world’s total fish production volume, in 2017 – for 48%; whilst in 2007, its share was only 34%.
As for the major fish-producing countries, China is the unrivalled leader in the global arena by far outpacing the other countries. It contributes over 30% to the world’s total fish output. Last year, China’s fish production volume exceeded 58.8 million metric tons. India comes second with the fish output volume of nearly 9.45 million metric tons in 2017. The third position is held by Indonesia which produced appr. 6,1 million metric tons of fish in the past year.
10 leading fish producing countries, 2017 (in million metric tons).jpg)
Despite the declining amount of the wild-caught fish, the world’s fish production is poised to continue following an upward trend due to a steady increase in fish farming. In the next decade, the volume of the global aquaculture sector is projected to add around 4-5% per year. In the year 2025, the world’s aquaculture production is slated to go beyond 100 million metric tons. The overall fish production volume is likely to rise by appr. 15,5% during 2018-2030 and come to 201 million metric tons in the year 2030.
CONSUMPTION
The consumption volume of fish products has demonstrated an incremental increase across the globe during the past years. In 2016, the world’s average per capita consumption of fish and fishery products surpassed the 20 kilograms mark. In 2017, it was estimated at 20.3 kilograms. Presently, aquaculture accounts for around 50% of all the seafood consumed across the globe.
Global average annual per capita consumption of fish products over 2014-2017 (in kilograms)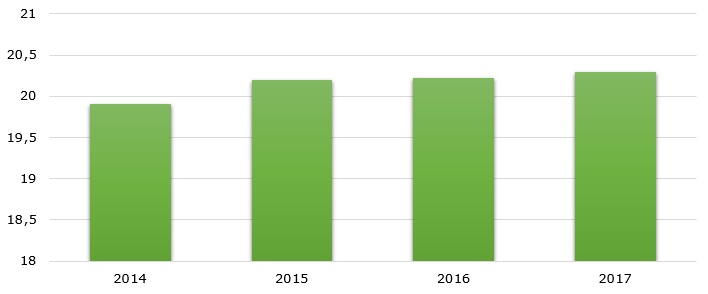
China tops the list of the world’s biggest fish-consuming nations. It is followed by Japan and the US.
The global volume of fish consumption has more than doubled during the past 50 years and is predicted to keep on going up along with the increasing global population.
IMPORTS
The mounting demand for fish from pole to pole is the key growth trigger of the global fish consumption and foreign trade. The major fish importers include the US, China, Japan, and the EU countries, amidst others.
Major importers of fish & fishery products, 2017 (in billion USD)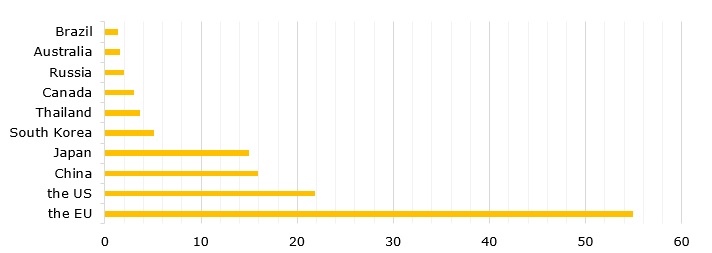
As of 2017, the combined value of the EU fish and fishery products imports totaled USD 54.9 billion. In the same year, the value of fish and fishery products imported to the US reached USD 21.8 billion, to China – USD 15.9 billion, and to Japan – USD – 15 billion.
EXPORTS
The global fish trade will keep on growing and is projected to hit new height this year, encouraged by the improving economic environment worldwide, escalating fish products consumption, and rising prices of popular fish species. In 2017, the global fish exports value registered a 7% YoY gain and amounted to USD 153.5 billion. Meantime, the exports volume totaled around 60.7 million metric tons.
Global fish exports value and volume during 2015-2017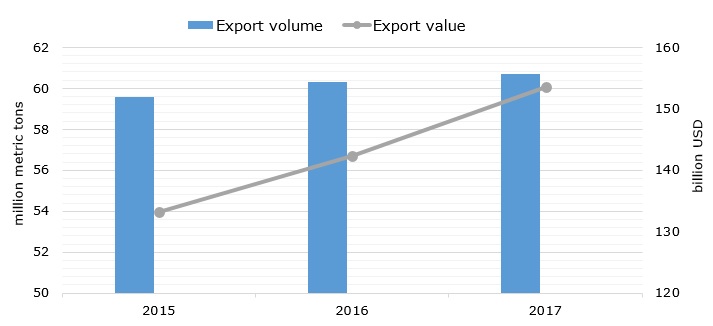
China, Norway, and Vietnam are the top three exporters of fish in the world. Last year, the value of the fish and fishery products exported from China was estimated at USD 22.8 billion. Meantime, Norway’s fish exports totaled USD 11.7 billion in 2017 and Vietnam’s – USD 7.7 billion.
Leading fish-exporting countries, 2017 (in billion USD)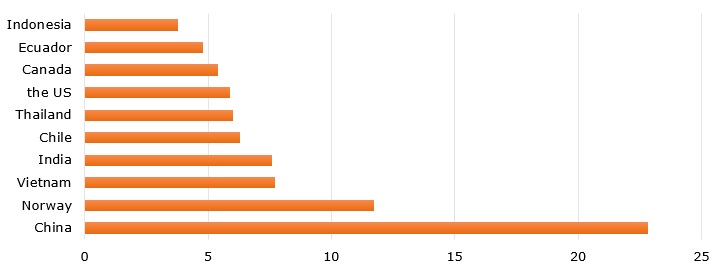
Conclusion
The world’s fish market is anticipated to maintain a steady modest growth pace in the coming years. The market will likely be boosted by the increasing availability of various fish species, rising global population, enhancing concerns of a healthy diet, and mounting demand for rich-protein food. The APAC region is expected to stay in a leadership position in the worlds fish market in the years ahead.
© MarketPublishers.com, 2018
Some of Related Reports Available at MarketPublishers.com:
- Fish & Seafood Global Industry Almanac 2013-2022
- Global Markets for Aquaculture Products
- The 2019-2024 World Outlook for Fish Markets
- Global Fish and fish meal for human consumption Market Business Development Opportunities- Available Tenders, Contracts, values and Companies, 2018- 2023
- Global Seafood Market with Focus on Atlantic Salmon Market: Size, Trends & Forecasts (2018-2022)
- Country Profile: Fish & Seafood in China
- Country Profile: Fish & Seafood in India
- Country Profile: Fish & Seafood in Indonesia
- Country Profile: Fish & Seafood in Japan
- FISH OIL (CAS 8002-50-4) Market Research Report 2018
- Global Fishing Equipments Industry Market Research Report
- 2017 Global Fish Feed Industry Report
Analytics & News