Global Smart Homes, Buildings (Energy Efficient, Automated) Market (Applications, Technologies, Products and End-User), Size, Share, Trends, Analysis, Research, Future Demand, Scope and Forecast, 2013 - 2020

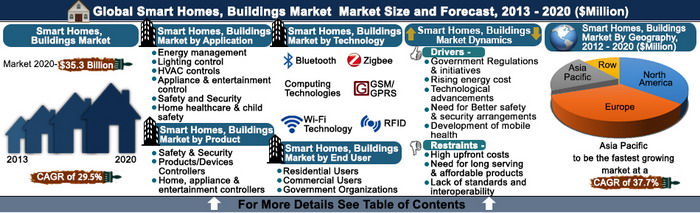
The global smart homes and buildings market is expected to grow at a significant CAGR of 29.5% between 2013 and 2020. This is attributed to rising energy costs and government initiatives. Some of the key government initiatives include regulations such as Commercial Buildings Initiatives (CBI) by the U.S. government aims at making all commercial buildings completely energy independent by 2025. This implies that commercial buildings should have facilities to generate onsite power. Energy efficiency has become the need of the hour as it is expected that energy demand would increase by 40% between 2010 and 2040. The key restraint for the growth is the high upfront investment that is required for well-integrated smart technologies. Perceived value versus the cost issue is still a concern that is impacting the adoption rates. Increasing smart homes and buildings with well-integrated and applied technologies will precisely lead to envisioned concept of “Smart Cities”
KEY BENEFITS
KEY BENEFITS
- This report provides market intelligence with respect to applications, products, technologies, end-users and geography so that companies can make precise investment decisions
- In-depth analysis of top factors such as drivers, restraints and opportunities affecting the market growth and their impact in the short and mid-term.
- Value chain analysis provides for the significance and role of all stakeholders of the market
- Porter’s five forces analysis offers insights into the potency of buyers and suppliers and competitive scenario of the market
- SWOT analysis and strategic developments of key players are included in the report so that companies can understand moves of competitors and make the required changes to have a sustainable growth
- Examine the challenges and opportunities in the smart homes and buildings market so that companies can overcome the challenges and capitalize on the opportunities
- Estimations are derived from the current market situation and projected future trends for the period of 2013-2020 with 2012 as base figures
- Geographic analysis offers in-depth suggestions of the trends in various region; therefore, companies can make region specific strategies to gain competitive advantages
- Smart homes and buildings technology, product and solutions providing companies, dealers, and wholesalers
- Any other companies interested in entering the smart buildings market
- System integrators and software vendors
- Academic and research institutes
CHAPTER 1. INTRODUCTION
1.1. Objectives & Scope
1.2. Key benefits
1.3. Key deliverables
1.4. Key Audiences
1.5. Research methodology
1.5.1. Secondary research
1.5.2. Primary research
1.5.3. Analyst tools and models
CHAPTER 2. EXECUTIVE SUMMARY
CHAPTER 3. GLOBAL SMART HOMES, BUILDINGS (ENERGY EFFICIENT, AUTOMATED) MARKET OVERVIEW
3.1. Market Definition and Scope
3.2. Key Findings
3.2.1. Top Factors Impacting Smart, Automated and Energy Efficient Homes and Buildings Market
3.2.1.1. Government Regulations
3.2.1.2. Rising cost of Energy
3.2.1.3. Technological advancements
3.2.1.4. Lack of standards and interoperability between technologies
3.2.1.5. Development of mobile health
3.2.1.6. Need for Better safety and security arrangements
3.2.1.7. High Upfront Cost
3.2.1.8. Need for long serving products
3.2.1.9. Need of smart grids
3.2.1.10. Smart cities for the future
3.2.2. Top winning strategies
3.2.2.1. Energy Management
3.2.2.2. Safety and security
3.2.2.3. Lighting Control
3.2.2.4. Other applications
3.2.3. Top investment pockets in Smart, Automated and Energy Efficent Homes and Buildings Market
3.2.3.1. Energy management, lighting control and safety and security offer great investment opportunities
3.2.3.2. GSM/GPRS and Zigbee are expected to emerge as top investment pockets in technology segment
3.2.3.3. Residential users and government expected to be the top estimation opportunities in end-user segment
3.2.3.4. Safety and security devices and controllers are expected to be top investment pockets in the product segment
3.2.3.5. Asia-Pacific and RoW regions to be top investment pockets
3.3. Porter’s Five Force Analysis
3.3.1. Bargaining power of suppliers is different in various regions
3.3.2. Consumer demand defines the high bargaining power of buyers
3.3.3. Evolving market increases the competition
3.3.4. Use of universal technologies eases new entrants in the market
3.3.5. Technological innovations lead to development of new products
3.4. Regulatory Initiatives
3.5. Value Chain Analysis
3.5.1. Role of manufacturers
3.5.2. Role of wholesalers and distributors
3.5.3. Role of retailers
3.5.4. Role of government
3.6. Energy efficiency: The need of the hour
3.6.1. Need for energy efficiency
3.7. Technological advances and geographic adoption
3.8. Role of smartphone’s, tablets and laptops
3.9. Elderly Population and Home Healthcare
3.10.Case Studies
3.10.1. CASE STUDY 1: Deployment of smart buildings technologies to increase energy efficiency
3.10.2. CASE STUDY 2: Implementation of building automation system (BMS) to increase safety and reduce energy cost in a mall
3.10.3. CASE STUDY 3: Deployment of access control and security system in the forensic department site of South Africa Police Service
3.10.4. CASE STUDY 4: Energy management at home in summer to cut electricity bill
3.10.5. CASE STUDY 5: Deployment of automated controls to increase energy efficiency in individual rooms of a resort
3.11. Market Dynamics
3.11.1. Drivers
3.11.1.1. Government Regulations and initiatives
3.11.1.2. Rising energy cost
3.11.1.3. Technological advancements
3.11.1.4. Need for Better safety and security arrangements
3.11.1.5. Development of mobile health
3.11.2. Restraints
3.11.2.1. High upfront costs
3.11.2.2. Need for long serving and affordable products
3.11.2.3. Lack of standards and interoperability
3.11.3. Opportunities
3.11.3.1. Global need of smart grids
3.11.3.2. Smart cities for the future
CHAPTER 4. GLOBAL SMART HOMES, BUILDINGS (ENERGY EFFICIENT, AUTOMATED) MARKET BY APPLICATION
4.1. Global smart, automated and energy efficient homes and buildings market, by application, 2012-2020, million
4.2. Energy management
4.2.1. Global energy management application market, by geography, 2012-2020, $million
4.2.2. Drivers for Energy Management
4.2.2.1. Increasing cost of energy
4.2.2.2. Need to reduce greenhouse gas emission
4.2.2.3. Provides for overall comfort
4.2.3. Restraints for energy management application
4.2.3.1. Upfront cost with long payback time
4.2.3.2. Certain functionalities are unsafe
4.3. Lighting control
4.3.1. Global lighting control application market, by geography, 2012-2020, $Million
4.3.2. Drivers of the lighting control application
4.3.2.1. Intelligent use of lighting
4.3.2.2. Easy maintenance and modification
4.3.2.3. Avoidance of accidents
4.3.2.4. Increase in attractiveness
4.3.3. Restraints of lighting control
4.3.3.1. Complex configuration process of wired lighting
4.3.3.2. High cost
4.4. Heating, ventilation and air conditioning (HVAC) controls
4.4.1. Global HVAC control application market, by geography, 2012-2020, $Million
4.4.2. Drivers for HVAC control application
4.4.2.1. Regulatory obligations
4.4.2.2. Room and climate specific temperature control
4.4.2.3. Remote access and motion sensing ability
4.4.2.4. Air heating control
4.4.3. Restraints of HVAC control application
4.4.3.1. High cost of intelligent HVAC control
4.4.3.2. Low adoption in retrofit homes and offices
4.5. Appliance and entertainment control
4.5.1. Global appliance and entertainment market, by geography, 2012-2020, $Million
4.5.2. Drivers of Appliance and Entertainment control application
4.5.2.1. Increased life of appliances
4.5.2.2. Manage entertainment devices
4.5.3. Restraints of Appliance and Entertainment control application
4.6. Safety and Security
4.6.1. Global safety & security application market, by geography, 2012-2020, $Million
4.6.2. Drivers of safety and security application
4.6.2.1. Growing safety concerns
4.6.2.2. Eases safety in emergency
4.6.2.3. Provides peace of mind for end-users
4.6.3. Restraints of Safety and Security application
4.6.3.1. High maintenance cost
4.7. Home healthcare and child safety
4.7.1. Home healthcare for the ageing
4.7.2. Child safety
4.7.3. Global home healthcare & child safety application market, by geography, 2012-2020, $Million
4.7.4. Drivers for home healthcare for ageing and childcare application
4.7.4.1. Independence for the old people
4.7.4.2. Omnipresent childcare
4.7.5. Restraints for home healthcare for ageing and childcare application
4.7.5.1. Technological complexities
CHAPTER 5. GLOBAL SMART HOMES, BUILDINGS (ENERGY EFFICIENT, AUTOMATED) MARKET BY TECHNOLOGY
5.1. Global smart, automated and energy efficient homes and buildings market, by technology, 2012-2020, $Million
5.2. Bluetooth
5.2.1. Global bluetooth technology market for smart homes and buildings, by geography, 2012-2020, $Million
5.3. Zigbee
5.3.1. Global Zigbee technology market for smart homes and buildings, by geography, 2012-2020, $Million
5.4. Radiofrequency identification (RFID)
5.4.1. Global RFID technology market for smart homes and buildings, by geography, 2012-2020, $Million
5.5. GSM/GPRS- Cellular technology
5.5.1. Global GSM/GPRS technology market for smart homes and buildings, by geography, 2012-2020, $Million
5.6. Wi-Fi Technology
5.6.1. Global Wi-Fi technology market for smart homes and buildings, by geography, 2012-2020, $Million
5.7. Computing Technologies
5.8. Drivers of smart building technology market
5.8.1. Advances in technology
5.8.2. Cost-effectiveness
5.8.3. Easy implementation in retrofit buildings
5.8.4. Comprehensive automation
5.9. RESTRAINTS OF SMART BUILDING TECHNOLOGY MARKET
5.9.1. Lack of technological awareness
5.9.2. Complexities of technology
5.9.3. Regional imbalance in technological exposure
5.10. Opportunities of smart building technology market
CHAPTER 6. GLOBAL SMART HOMES, BUILDINGS (ENERGY EFFICIENT, AUTOMATED) MARKET BY END-USER
6.1. Global End- users market for smart homes and buildings, 2012-2020, $Million
6.2. Residential Users
6.2.1. Global Residential users market for smart homes and buildings, 2012-2020, $million
6.2.2. Individual Homes
6.2.3. Global Individual homes market for smart homes and buildings by geography, 2012-2020, $million
6.2.4. Residential buildings and housing societies
6.2.5. Global residential buildings and housing societies market for smart homes and buildings by geography, 2012-020, $million
6.3. Commercial Users
6.3.1. Global commercial users market for smart homes and buildings, 2012-2020$million
6.3.2. Corporate offices
6.3.2.1. Global corporate offices market for smart homes and buildings by geography, 2012-2020, $million
6.3.3. Industrial production units
6.3.3.1. Global industrial production units market for smart homes and buildings by geography, 2012-2020, $million
6.3.4. Healthcare Facilities
6.3.4.1. Global healthcare facilities market for smart homes and buildings by geography, 2012-2020, $million
6.3.5. Retail Outlets and Convenient Stores
6.3.5.1. Global retail outlets and convenient stores market for smart homes and buildings by geography, 2012-2020, $million
6.3.6. Hotels and Restaurants
6.3.6.1. Global hotels & restaurants stores market for smart homes and buildings by geography, 2012-2020, $million
6.4. Government Organizations
6.4.1 Global Government organizations market for smart homes and buildings by geography, 2012-2020, $million
6.5. Drivers of smart building by End user
6.5.1. Rising energy cost
6.5.2. Environmental awareness
6.5.3. Better safety and security
6.5.4. Decline in prices of renewable energy
6.6. Restraints of smart building for End user
6.6.1. High investment and slow return on investment
6.6.2. Lack of technical expertise
CHAPTER 7. GLOBAL SMART HOMES, BUILDINGS (ENERGY EFFICIENT, AUTOMATED) MARKET BY PRODUCT
7.1. Drivers of smart homes and buildings market by products
7.1.1. Easy installation for retrofit
7.1.2. Reducing cost of products
7.1.3. Allow for better control of the lighting system
7.1.4. Provide for safety and security
7.2. Restraints of smart homes and buildings market by products
7.2.1. Additional cost
7.2.2. Technical complications
7.3. Global smart, automated and energy efficient homes and buildings market by products, 2012-2020, $million
7.4. Safety & Security Products/Devices
7.4.1. Global smart, automated and energy efficient homes and buildings market by safety & security products, 2012-2020, $million
7.4.2. Surveillance Cameras
7.4.2.1. Global surveillance cameras market for smart homes and buildings, by geography, 2012-2020, $million
7.4.3. Door and window locks
7.4.3.1. Global door and window locks market for smart homes and buildings by geography, 2012-2020, $million
7.4.4. Smoke detectors and fire sprinklers
7.4.4.1. Global smoke detectors and fire sprinklers market for smart homes and buildings by geography, 2012-2020, $million
7.5. Controllers
7.5.1. Global smart, automated and energy efficient homes and buildings market by controllers product, 2012-2020, $million
7.5.2. Sensors
7.5.2.1. Light Sensors
7.5.2.2. GLOBAL LIGHT SENSORS MARKET FOR SMART HOMES AND BUILDINGS BY GEOGRAPHY, 2012-2020, $million
7.5.2.3. Motion Sensors
7.5.2.4. Global motion sensors market for smart homes and buildings by geography, 2012-2020, $million
7.5.2.5. CO2 Sensors
7.5.3. Global CO2 sensors market for smart homes and buildings by geography, 2012-2020, $million
7.5.3.1. Dimmers
7.5.3.2. Global dimmers market for smart homes and buildings by geography,2012-2020, $million
7.5.3.3. Timers
7.5.3.4. Global timers market for smart homes and buildings by geography, 2012-2020, $million
7.5.3.5. Energy Efficient Lights
7.5.3.6. Global energy efficient lights market for smart homes and buildings by geography, 2012-2020, $million
7.6. Home. appliance & entertainment controllers
7.6.1. Global smart, automated and energy efficient homes and buildings market by home appliance & entertainment controllers, 2012-2020, $million
7.6.2. Thermostats
7.6.2.1. Global thermostats market for smart homes and buildings by geography, 2012-2020, $million
7.6.3. Remote Controls
7.6.3.1. GLOBAL REMOTE CONTROLS MARKET FOR SMART HOMES AND BUILDINGS BY GEOGRAPHY, 2012-2020, $million
7.6.4. Smart plugs and energy monitors
7.6.4.1. Global smart plugs and energy monitors market for smart homes and buildings by geography, 2012-2020, $million
CHAPTER 8. GLOBAL SMART HOMES, BUILDINGS (ENERGY EFFICIENT, AUTOMATED) MARKET BY GEOGRAPHY
8.1. Global smart, automated and energy efficient homes and buildings market, by geography, 2012-2020, $million
8.2. North America
8.2.1. Global smart, automated and energy efficient homes and buildings application market in North America, 2012-2020, $million
8.3. Europe
8.3.1. Global smart, automated and energy efficient homes and buildings application market In Europe, 2012-2020, $million
8.4. Asia-Pacific
8.4.1. Global smart, automated and energy efficient homes and buildings application market in Asia-pacific, 2012-2020, $million
8.5. RoW
8.5.1. Global smart, automated and energy efficient homes and buildings application market IN Row, 2012-2020, $million
CHAPTER 9. COMPANY PROFILES
9.1. Cisco Systems, Inc.
9.1.1. Company Overview
9.1.2. Company snapshot
9.1.3. Business Performance
9.1.4. Strategic moves and developments
9.1.4.1. Principal Strategies: Product Launches
9.1.4.2. Secondary Strategy: Partnerships
9.1.5. SWOT Analysis of Cisco Systems Inc.
9.2. Control4 Corporation
9.2.1. Company overview
9.2.2. Company snapshot
9.2.3. Strategic moves and developments
9.2.3.1. Principal Strategies: Product Launches
9.2.4. SWOT Analysis of Control4 Corporation
9.3. Leviton MFG. Company Inc.
9.3.1. Company overview
9.3.2. Company snapshot
9.3.3. Strategic moves and developments
9.3.3.1. Principal Strategies: Product Launches
9.3.3.2. Secondary Strategy: Acquisitions
9.3.4. SWOT Analysis of Leviton MFG. Company Inc.
9.4. Schneider Electric SA
9.4.1. Company overview
9.4.2. Company snapshot
9.4.3. Business performance
9.4.4. Strategic moves and developments
9.4.4.1. Principal Strategies: Product Launches
9.4.4.2. Secondary Strategy: Partnerships
9.4.5. SWOT Analysis of Schneider Electric SA.
9.5. Siemens Building Technologies
9.5.1. Company overview
9.5.2. Company snapshot
9.5.3. Business performance
9.5.4. Strategic moves and developments
9.5.4.1. Principal Strategies: Product Launches
9.5.5. SWOT Analysis of Siemens building technologies
9.6. United Technologies Corporation
9.6.1. Company overview
9.6.2. Company snapshot
9.6.3. Business performance
9.6.4. Strategic moves and developments
9.6.4.1. Principal Strategies: Product Launches
9.6.4.2. Secondary Strategy: Acquisition
9.6.5. SWOT Analysis of united technologies corporation
9.7. Honeywell Scanning & Mobility
9.7.1. Company overview
9.7.2. Company snapshot
9.7.3. Business performance
9.7.4. Strategic moves and developments
9.7.4.1. Principal Strategy: Product Launches
9.7.5. SWOT Analysis of Honeywell Scanning & Mobility
9.8. Smarthome, Inc.
9.8.1. Company overview
9.8.2. Company snapshot
9.8.3. strategic moves and developments
9.8.4. Principal Strategy: Product Launches
9.8.5. SWOT Analysis of smarthomes Inc.
9.9. Emerson Electric Co.
9.9.1. Company overview
9.9.2. Company snapshot
9.9.3. Business performance
9.9.4. Strategic moves and developments
9.9.4.1. Principal Strategies: Partnerships
9.9.4.2. Secondary Strategy: Product Launch
9.9.5. SWOT Analysis of Emerson Electric Co.
9.10. LG Electronics Inc
9.10.1. Company overview
9.10.2. Company snapshot
9.10.3. Business performance
9.10.4. Strategic moves and developments
9.10.4.1. Principal Strategies: Product Launches
9.10.4.2. Secondary Strategy: Partnerships
9.10.5. SWOT Analysis & strategic conclusions
LIST OF TABLES
TABLE 1 GLOBAL SMART, AUTOMATED AND ENERGY EFFICIENT HOMES AND BUILDINGS MARKET, BY GEOGRAPHY, 2012-2020 , $MILLION
TABLE 2 GLOBAL SMART, AUTOMATED AND ENERGY EFFICIENT HOMES AND BUILDINGS MARKET, BY APPLICATION, 2012-2020, $MILLION
TABLE 3 ENERGY MANAGEMENT PROGRAMS IN SOME COUNTRIES
TABLE 4 GLOBAL ENERGY MANAGEMENT APPLICATION MARKET, BY GEOGRAPHY, 2012-2020, $MILLION
TABLE 5 PROJECTS COMPLETION RATES IN PAST TWO YEARS
TABLE 6 GLOBAL LIGHTING CONTROL APPLICATION MARKET, BY GEOGRAPHY, 2012-2020, $MILLION
TABLE 7 GLOBAL HVAC CONTROL APPLICATION MARKET, BY GEOGRAPHY, 2012-2020, $MILLION
TABLE 8 GLOBAL APPLIANCE AND ENTERTAINMENT MARKET, BY GEOGRAPHY, 2012-2020, $MILLION
TABLE 9 GLOBAL SAFETY & SECURITY APPLICATION MARKET, BY GEOGRAPHY, 2012-2020, $MILLION
TABLE 10 GLOBAL HEALTHCARE & CHILD SAFETY APPLICATION MARKET, BY GEOGRAPHY, 2012-2020, $MILLION
TABLE 11 GLOBAL SMART, AUTOMATED AND ENERGY EFFICIENT HOMES AND BUILDINGS MARKET, BY TECHNOLOGY, 2012-2020, $MILLION
TABLE 12 GLOBAL BLUETOOTH TECHNOLOGY MARKET FOR SMART HOMES AND BUILDINGS, BY GEOGRAPHY, 2012-2020, $MILLION
TABLE 13 GLOBAL ZIGBEE TECHNOLOGY MARKET FOR SMART HOMES AND BUILDINGS, BY GEOGRAPHY, 2012-2020, $MILLION
TABLE 14 GLOBAL RFID TECHNOLOGY MARKET FOR SMART HOMES AND BUILDINGS, BY GEOGRAPHY, 2012-2020, $MILLION
TABLE 15 GLOBAL GSM/GPRS TECHNOLOGY MARKET FOR SMART HOMES AND BUILDINGS, BY GEOGRAPHY, 2012-2020, $MILLION
TABLE 16 GLOBAL WI-FI TECHNOLOGY MARKET FOR SMART HOMES AND BUILDINGS, BY GEOGRAPHY, 2012-2020, $MILLION
TABLE 17 GLOBAL END- USERS MARKET FOR SMART HOMES AND BUILDINGS, 2012-2020, $MILLION
TABLE 18 GLOBAL RESIDENTIAL USERS MARKET FOR SMART HOMES AND BUILDINGS, 2012-2020, $MILLION
TABLE 19 GLOBAL INDIVIDUAL HOMES MARKET FOR SMART HOMES AND BUILDINGS BY GEOGRAPHY, 2012-2020, $MILLION
TABLE 20 GLOBAL RESIDENTIAL BUILDINGS AND HOUSING SOCIETIES MARKET FOR SMART HOMES AND BUILDINGS BY GEOGRAPHY, 2012-2020, $MILLION
TABLE 21 GLOBAL COMMERCIAL USERS MARKET FOR SMART HOMES AND BUILDINGS, 2012-2020$MILLION
TABLE 22 GLOBAL CORPORATE OFFICES MARKET FOR SMART HOMES AND BUILDINGS BY GEOGRAPHY, 2012-2020, $MILLION
TABLE 23 GLOBAL INDUSTRIAL PRODUCTION UNITS MARKET FOR SMART HOMES AND BUILDINGS BY GEOGRAPHY, 2012-2020, $MILLION
TABLE 24 GLOBAL HEALTHCARE FACILITIES MARKET FOR SMART HOMES AND BUILDINGS BY GEOGRAPHY, 2012-2020, $MILLION
TABLE 25 GLOBAL RETAIL OUTLETS AND CONVENIENT STORES MARKET FOR SMART HOMES AND BUILDINGS BY GEOGRAPHY, 2012-2020, $MILLION
TABLE 26 GLOBAL HOTELS & RESTAURANTS STORES MARKET FOR SMART HOMES AND BUILDINGS BY GEOGRAPHY, 2012-2020, $MILLION
TABLE 27 GLOBAL GOVERNMENT ORGANIZATIONS MARKET FOR SMART HOMES AND BUILDINGS BY GEOGRAPHY, 2012-2020, $MILLION
TABLE 28 GLOBAL SMART, AUTOMATED AND ENERGY EFFICIENT HOMES AND BUILDINGS MARKET BY PRODUCTS, 2012-2020, $MILLION
TABLE 29 GLOBAL SMART, AUTOMATED AND ENERGY EFFICIENT HOMES AND BUILDINGS MARKET BY SAFETY & SECURITY PRODUCTS, 2012-2020, $MILLION
TABLE 30 GLOBAL SURVEILLANCE CAMERAS MARKET FOR SMART HOMES AND BUILDINGS, BY GEOGRAPHY, 2012-2020, $MILLION
TABLE 31 GLOBAL DOOR AND WINDOW LOCKS MARKET FOR SMART HOMES AND BUILDINGS BY GEOGRAPHY, 2012-2020, $MILLION
TABLE 32 GLOBAL SMOKE DETECTORS AND FIRE SPRINKLERS MARKET FOR SMART HOMES AND BUILDINGS BY GEOGRAPHY, 2012-2020, $MILLION
TABLE 33 GLOBAL SMART, AUTOMATED AND ENERGY EFFICIENT HOMES AND BUILDINGS MARKET BY CONTROLLERS PRODUCT, 2012-2020, $MILLION
TABLE 34 GLOBAL LIGHT SENSORS MARKET FOR SMART HOMES AND BUILDINGS BY GEOGRAPHY, 2012-2020, $MILLION
TABLE 35 GLOBAL MOTION SENSORS MARKET FOR SMART HOMES AND BUILDINGS BY GEOGRAPHY, 2012-2020, $MILLION
TABLE 36 GLOBAL CO2 SENSORS MARKET FOR SMART HOMES AND BUILDINGS BY GEOGRAPHY, 2012-2020, $MILLION
TABLE 37 GLOBAL DIMMERS MARKET FOR SMART HOMES AND BUILDINGS BY GEOGRAPHY ,2012-2020, $MILLION
TABLE 38 GLOBAL TIMERS MARKET FOR SMART HOMES AND BUILDINGS BY GEOGRAPHY, 2012-2020, $MILLION
TABLE 39 GLOBAL ENERGY EFFICIENT LIGHTS MARKET FOR SMART HOMES AND BUILDINGS BY GEOGRAPHY, 2012-2020, $MILLION
TABLE 40 GLOBAL SMART, AUTOMATED AND ENERGY EFFICIENT HOMES AND BUILDINGS MARKET BY HOME APPLIANCE & ENTERTAINMENT CONTROLLERS, 2012-2020, $MILLION
TABLE 41 GLOBAL THERMOSTATS MARKET FOR SMART HOMES AND BUILDINGS BY GEOGRAPHY, 2012-2020, $MILLION
TABLE 42 GLOBAL REMOTE CONTROLS MARKET FOR SMART HOMES AND BUILDINGS BY GEOGRAPHY, 2012-2020, $MILLION
TABLE 43 GLOBAL SMART PLUGS AND ENERGY MONITORS MARKET FOR SMART HOMES AND BUILDINGS BY GEOGRAPHY, 2012-2020, $MILLION
TABLE 44 REPRESENTATION OF THE KEY GLOBAL TRENDS OF SMART HOMES AND BUILDINGS MARKET
TABLE 45 GLOBAL SMART, AUTOMATED AND ENERGY EFFICIENT HOMES AND BUILDINGS MARKET, BY GEOGRAPHY, 2012-2020, $MILLION
TABLE 46 GLOBAL SMART, AUTOMATED AND ENERGY EFFICIENT HOMES AND BUILDINGS APPLICATION MARKET IN NORTH AMERICA, 2012-2020, $MILLION
TABLE 47 GLOBAL SMART, AUTOMATED AND ENERGY EFFICIENT HOMES AND BUILDINGS APPLICATION MARKET IN EUROPE, 2012-2020, $MILLION
TABLE 48 GLOBAL SMART, AUTOMATED AND ENERGY EFFICIENT HOMES AND BUILDINGS APPLICATION MARKET IN ASIA-PACIFIC, 2012-2020, $MILLION
TABLE 49 GLOBAL SMART, AUTOMATED AND ENERGY EFFICIENT HOMES AND BUILDINGS APPLICATION MARKET IN ROW, 2012-2020, $MILLION
TABLE 50 CISCO SYSTEMS, INC
TABLE 51 CONTROL4 CORPORATION
TABLE 52 LEVITON MFG. COMPANY INC.
TABLE 53 SCHNEIDER ELECTRIC
TABLE 54 SIEMENS BUILDING TECHNOLOGIES
TABLE 55 UNITED TECHNOLOGIES CORPORATION
TABLE 56 HONEYWELL SCANNING & MOBILITY
TABLE 57 SMARTHOME, INC.
TABLE 58 EMERSON ELECTRIC CO.
TABLE 59 LG ELECTRONICS INC
LIST OF FIGURES
FIG. 1 SMART HOMES AND BUILDINGS MARKET SCOPE
FIG. 2 IMPACT ANALYSIS OF TOP TEN FACTORS IMPACTING THE SMART HOMES AND BUILDINGS MARKET
FIG. 3 TOP WINNING STRATEGIES BASED ON APPLICATIONS
FIG. 4 TOP INVESTMENT OPPORTUNITIES BY APPLICATIONS
FIG. 5 PORTER’S FIVE FORCE ANALYSIS
FIG. 6 VALUE CHAIN ANALYSIS
FIG. 7 SHARE IN GREENHOUSE GAS EMISSION, 2010
FIG. 8 USE OF SMARTPHONES GLOBALLY
FIG. 9 TRENDS OF NUCLEAR FAMILIES IN URBAN INDIA
FIG. 10 CHANGING WORLD AND REGIONAL AGE COMPOSITION: 2012 TO 2050.
FIG. 11 WORLD ENERGY CONSUMPTION HISTORY & PROJECTIONS
FIG. 12 ELECTRICITY PRICES RELATIVE TO PURCHASING POWER
FIG. 13 ENERGY USAGE IN SUPERMARKETS
FIG. 14 LED LIGHTS PRICE TREND
FIG. 15 GLOBAL SMART, AUTOMATED AND ENERGY EFFICIENT HOMES AND BUILDINGS MARKET BY GEOGRAPHY, CAGR% 2012-2020
FIG. 16 FINANCIAL REVENUE BY GEOGRAPHY (2013)
FIG. 17 FINANCIALS BY SEGMENT (2013)
FIG. 18 SWOT ANALYSIS OF CISCO SYSTEMS INC.
FIG. 19 SWOT ANALYSIS OF CONTROL4 CORPORATION
FIG. 20 SWOT ANALYSIS LEVITON MFG. COMPANY INC.
FIG. 21 FINANCIAL REVENUE BY GEOGRAPHY (2013)
FIG. 22 FINANCIALS BY SEGMENT (2013)
FIG. 23 SWOT ANALYSIS OF SCHNEIDER ELECTRIC SA.
FIG. 24 FINANCIAL REVENUE BY GEOGRAPHY (2013)
FIG. 25 FINANCIAL BY SEGMENT (2013)
FIG. 26 SWOT ANALYSIS SIEMENS BUILDING TECHNOLOGIES
FIG. 27 FINANCIAL REVENUE BY GEOGRAPHY (2012)
FIG. 28 FINANCIAL BY SEGMENT (2012)
FIG. 29 SWOT ANALYSIS OF UNITED TECHNOLOGIES CORPORATION
FIG. 30 FINANCIAL REVENUE BY GEOGRAPHY (2012)
FIG. 31 FIGURE FINANCIAL BY SEGMENT (2012)
FIG. 32 SWOT ANALYSIS HONEYWELL SCANNING & MOBILITY.
FIG. 33 SWOT ANALYSIS SMARTHOME, INC.
FIG. 34 FIGURE FINANCIAL REVENUE BY GEOGRAPHY (2012)
FIG. 35 FIGURE FINANCIAL BY SEGMENT (2012)
FIG. 36 SWOT ANALYSIS EMERSON ELECTRIC CO.
FIG. 37 FINANCIAL REVENUE BY GEOGRAPHY (2013)
FIG. 38 SWOT ANALYSIS LG ELECTRONICS INC
COMPANIES MENTIONED
Cisco Systems, Inc., Control4 Corporation, Leviton MFG. Company Inc., Schneider Electric SA, Siemens Building Technologies, United Technologies Corporation, Honeywell Scanning & Mobility, Smarthome, Inc., Emerson Electric Co. and LG Electronics Inc

